-
Introduction
NASP is a parallel program that takes as input a nucleotide sequence alignment and returns the most probable evolutionarily conserved consensus secondary structure. NASP uses a recursive permutation-based approach to progressively identify structures with the greatest degrees of evolutionary conservation and yields a list of secondary structures that are likely to have the greatest biological relevance. By focusing on identifying only the evolutionarily conserved structures, NASP forgoes the prediction of complete nucleotide folds but outperforms various other secondary structure prediction methods in its ability to selectively identify actual base-pairings.
Method
- First NASP generates a consensus matrix `M` whose entries `M_{ij}` are given by:
`M_{ij}= 2^{C_{ij}}\delta_{ij} \sum_{k=1}^N \omega_k L_k` - where
- `L_k = log((P_k(i,j))/P_0)` if the sequence length is not greater than `5Kb` and `L_k=f_k(i,j)` otherwise. Here
- `P_k(i,j)` is the probability that nucleotide at position `i` and nucleotide at position `j` in sequence `k` form a base-pair. These probabilities are chosen to be above a user specified threshold probability `P_0`. The `P_k(i,j)`'s are provided by the UNAFold program hybrid-ss (Markham and Zuker., 2008).
- `f_k(i,j)` is the frequency with which nucleotide at position `i` and nucleotide at position `j` in sequence `k` form a base-pair within the set of sub-optimal structures provided by the UNAFold program UNAFold.pl.
- `N` is the number of sequences and `w_k` is the mean pair-wise Hamming distance of sequence `k` from all others in the alignment, `w_k` weighs the contribution to `M_{ij}` of more divergent sequences more heavily than those of less divergent sequences.
- `\delta_{ij}` is the gap penalty and is 0 if the gap frequency at either column position `i` or `j` is greater or equal to 0.75 and 1 otherwise.
- `C_{ij}` is the mutual information of columns i and j and accounts for compensatory mutations. It is given by
`C_{ij}= - \sum_{a, b=A, C, G, T} \log2((f_{ij}(a,b))/(f_i(a)f_j(b)))` where `f_i(a)` is the frequency of nucleotide `a` at alignment position `i` and `f_{ij}(a,b)` is the frequency of finding nucleotide `a` at position `i` and `b` at position `j` in the alignment.
- NASP then uses a heuristic method to scan M through the anti-diagonal. It recursively identifies contiguous sets of non-zero entries along the anti-diagonal of the matrix that have the highest sum. The sums of these non-zero entries correspond, for example, with the stem sequences of hairpin structures. At each step, an additional unaccounted-for stem structure (chosen as that with the highest associated sum) is added to a growing list of potentially paired sites. The alignment columns corresponding with sites that are not yet included in this list are randomly shuffled by either a mono-nucleotide or a di-nucleotide shuffling procedure. The existence of additional unaccounted-for structural motifs in the sequences is inferred when the MFE estimates of all sequences in the unshuffled alignment are smaller than those of at least 95% of the corresponding sequences in the shuffled alignments. That is the combine p-value (Bailey,T.L. et al., 1997) is at most 0.05. The flow diagram of this method can be seen in Fig.1 below.
- First NASP generates a consensus matrix `M` whose entries `M_{ij}` are given by:
Assessment of NASP
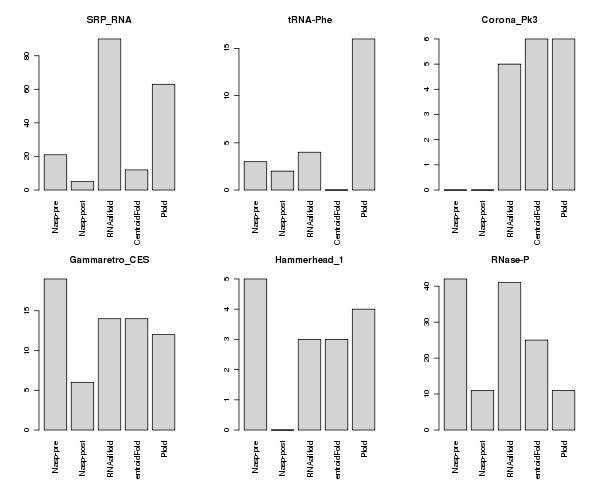
Using reference sequences with known secondary structures, the performance of NASP was compared to that of three other methods: RNAalifold (Bernhard et al., 2008), CentroidFold (Hamada et al., 2009) and Pfold (Knudsen and Hein, 2003; Fig.2). Whereas NASP post enrichment outperformed the other four methods in terms of its selectivity (this is essentially because it has a very low false positive rate), it suffers from a high false negative rate such that its over-all accuracy, measured here by the Matthews correlation coefficient (MCC), was not appreciably different from that of the other methods.
Input sequences
The input sequence alignment must be in Pearson/Fasta format. For the moment because of the limitations on our cluster resources, we only accept alignments with the following characteristics. You can download and install the standalone version for local use here.
Length of a sequence MAX. number of sequences Less than or equal to 1000 nts 100 Between 1001 and 4000 nts 30 Between 4001 and 8000 nts 10 Between 8001 and 10000 nts 5 NB. Sequences longer than 2000 bases are split during the permutation test to speed up the computation. Once the list of potential secondary structure motifs is computed, the program carefully choose the breakpoints in such a way that any base pair is not disrupted.
Analysis parameters
Temperature: The folding temperature in degrees Celsius, its default value is set to 37 degrees Celsius.
Sequence type: Tells the program whether sequences should be considered as either RNA or DNA, the default is set to RNA. The valid nucleotides are A, C, G, T and U (case are irrelevant) and the insertion/deletion symbol -, any other symbol will be ignored.
Sequence shape: Determines whether the sequences are considered as linear or circular. The default is set to linear.
d_value: The d-value can be set to any non-negative integer between 0 and 10. All nucleotides falling within d alignment columns up- and down-stream of a nucleotide column are considered to be its potential homologues. The default value set to 0.
Minimum length: Any positive integer representing the minimum length allowed for a sub-structure, (e.g. if set 2, it means avoiding isolated base-pairs). The default is set to 2.
Sodium ion concentration: Given in mols per liter (for example the concentration of sodium in human blood plasma is ~0.3 Mol/liter). The default value is set to 1 mol/l.
Magnesium ion concentration: Given in mols per liter (for example the concentration of magnesium in human cells is ~0.004 Mol/liter). The default value is set to 0 mol/l
Compute p-value: If set to "no", p-value support will not be calculated - i.e. the only output will be the consensus matrix and the consensus structure. The default setting in "yes".
Number of permutations for p-values computations: Either 10 or 100 randomly generated sequences will be used to compute the p-values at each iteration. The p-values indicate the probability that no additional unaccounted for structures remain within the analysed sequences. The default value is 100.
Permutation strategy: Mono-nucleotide shuffling will randomly shuffle nucleotide columns that are not within the constrained sites list. The di-nucleotide shuffling option will only semi-randomly shuffle nucleotide columns that are not within the constrained sites list but will preserve the dinucleotide frequency composition of the shuffled alignment columns (dinucleotide frequencies are a factor that could be important in determining the over-all secondary structure performing potential of nucleotide sequences). The default setting is mono-nucleotide shuffling.
Output files
The output consists of several files:- A text file containing a summary of the input data, the coordinates of potentially conserved stems and p-values indicating statistical support for additional unaccounted for secondary structures remaining in the sequences following each recursion.
- The consensus base-pairing matrix in comma separated value format and PNG format (Pavlidis, P. and Noble W.S., 2003).
- the consensus structure in both the Vienna bracket-dot and a concatenation file formats.
References
- Bernhart,S.H et al. (2008) RNAalifold: Improved consensus structure prediction for RNA alignments. BMC Bioinformatics, 9:474
- Hamada,M. et al. (2009) Predictions of RNA secondary structure using generalized centroid estimators. Bioinformatics, 25:465-673
- Knudsen,B. and Hein,J. (2003) Pfold: RNA secondary prediction using stochastic context-free grammars. Nucl. Acids Res., 31:3423
- Markham,N.R. and Zuker,M. (2008) UNAFold: software for nucleic acid folding and hybridization. Method Mol Bio., 453, 3-31.
- Pavlidis, P. and Noble W.S. (2003) Matrix2png: A Utility for Visualizing Matrix Data. Bioinformatics 19: 295-296
- Timothy L. Bailey and Michael Gribskov (1997) Combining evidence using p-values: application to sequence homology searches. Bioinformatics, 14:48-54
Figures
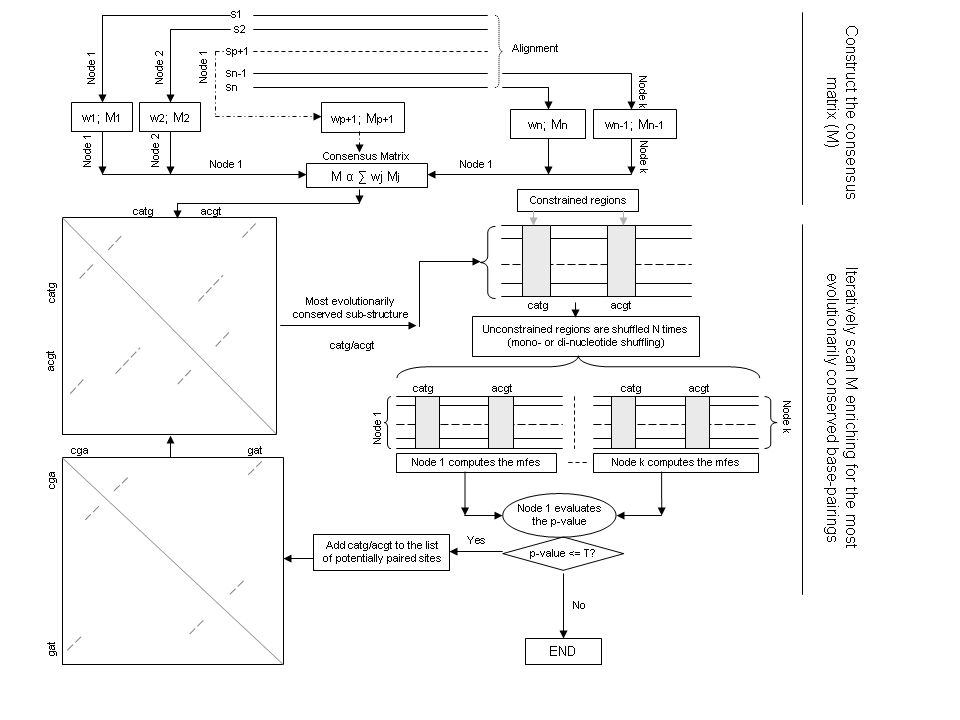
Fig.1: Flow diagram describing the process implemented in NASP. `T` is a user-specified threshold p-value.
| False positive rate |
|---|
 |
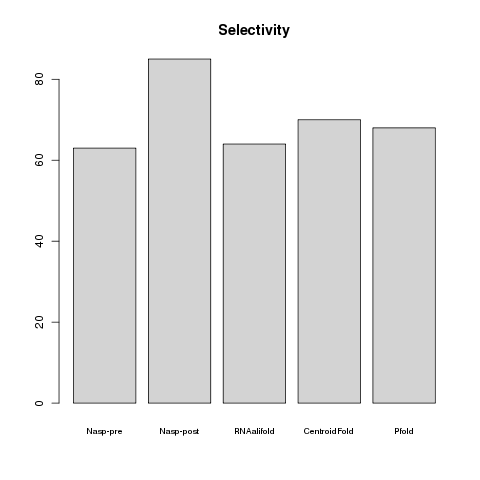 |
Fig.2: False positive rates for six methods with respect to four control data sets (top)
and NASP over-all selectivity (bottom).