# Using the SCOREM approach one can filter marker genes that have consisten
# whose expression values in a given datasets.
# This is because the notion of marker can be very dependent on the data, biological
# conditions or platform used to define them.
# load kidney transplant dataset from Shen-Orr et al. (2010)
eset <- ExpressionMix('GSE20300', verbose=TRUE)
Loading dataset 'GSE20300' ... OK
# load HaemAtlas marker gene list (on Illumina)
ml <- MarkerList('HaemAtlas')
ml
Types: B-CD19, Erythroblast, ..., T-CD8 (total: 8)
Mode: character
setName: HaemAtlas
geneIds: ILMN_1793637, ILMN_1663575, ..., ILMN_1815673 (total: 2069)
geneIdType: Annotation (illuminaHumanv2.db)
collectionType: Null
geneValues: NA
details: use 'details(object)'
# convert marker IDs to Affy IDs from dataset
# using stringent one to one mapping
mla <- convertIDs(ml, eset, method='1:1', verbose=TRUE)
# Converting 2069 markers from Annotation (illuminaHumanv2.db) to Annotation (hgu133plus2.db) ... OK [643/2069 (1:1)]
# Processing 2069 markers from Annotation (illuminaHumanv2.db) to Annotation (hgu133plus2.db) ... OK [631/2069 (1:1)]
summary(mla)
Types: 8 ['B-CD19', 'Erythroblast', ..., 'T-CD8']
Mode: character
Markers: 631
IDtype: .Affymetrix ['206513_at', '207655_s_at', ..., '219025_at']
Source: hgu133plus2.db
Breakdown:
B-CD19 Erythroblast Granulocyte-CD66b Megakaryocyte Monocyte-CD14 NK-CD56 T-CD4
55 113 231 106 79 27 18
T-CD8
2
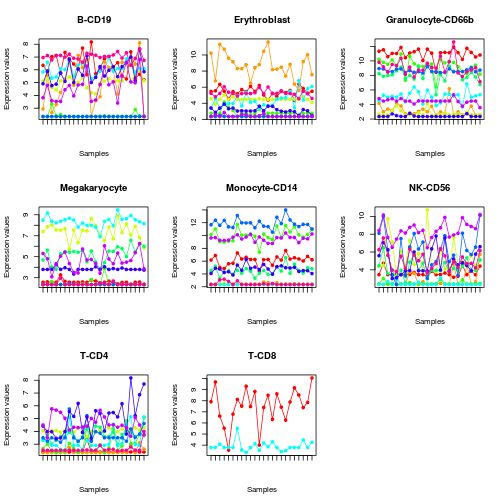
# plot expression profile of each set of markers (only the first 10)
profplot(mla[, 1:10], eset, split=TRUE, lab='')
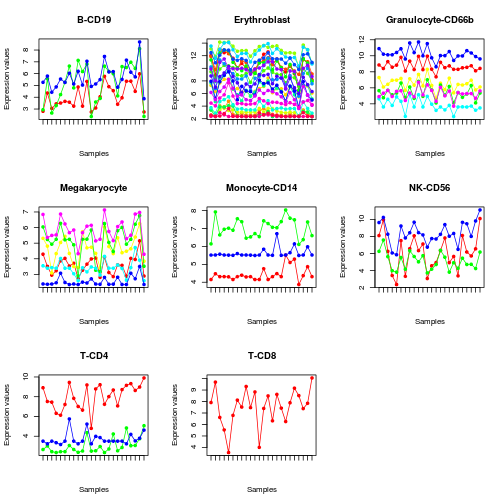
# filter out using SCOREM
sml <- extractMarkers(mla, eset, method='scorem', alpha=.005)
# plot selected markers
profplot(sml, eset, split=TRUE, lab='')