DSA Algorithm: Digital Sorting Algorithm


####################################################
# Sample deconvolution analysis with DSA in CellMix
####################################################
# load benchmark data
x <- ExpressionMix('GSE19830', verbose=TRUE)
Loading dataset 'GSE19830' ... OK
dim(x)
Features Samples Components 31099 42 3
annotation(x)
[1] "rat2302.db"
# extract mixed samples
mix <- mixedSamples(x)
# load TIGER marker list
ml <- MarkerList('TIGER')
ml
Types: bladder, blood, ..., uterus (total: 30) Mode: numeric setName: TIGER geneIds: Hs.405866, Hs.281295, ..., Hs.424414 (total: 7743) geneIdType: Unigene (org.Hs.eg.db) collectionType: Null geneValues: 99.8603, 78.4616, ..., 5.04784 details: use 'details(object)'
names(ml)
[1] "bladder" "blood" "bone" "bone_marrow" [5] "brain" "cervix" "colon" "eye" [9] "heart" "kidney" "larynx" "liver" [13] "lung" "lymph_node" "mammary_gland" "muscle" [17] "ovary" "pancreas" "peripheral_nervous_system" "placenta" [21] "prostate" "skin" "small_intestine" "soft_tissue" [25] "spleen" "stomach" "testis" "thymus" [29] "tongue" "uterus"
# select markers for the tissues present in the mixture
basisnames(x)
[1] "Brain" "Liver" "Lung"
ml <- ml[c('brain', 'liver', 'lung')]
summary(ml)
Types: 3 ['brain', 'liver', 'lung'] Mode: numeric Markers: 868 IDtype: UNIGENE ['Hs.7124', 'Hs.12440', ..., 'Hs.228320'] Values: [7.26871, 7.26871, ..., 5.00013] Source: org.Hs.eg.db Breakdown: brain liver lung 342 334 192
# convert to match annotations
mlx <- convertIDs(ml, mix, verbose=TRUE)
# Converting 868 markers from Unigene (org.Hs.eg.db) to Annotation (rat2302.db) ... OK [261/868 (1:1)] # Processing 868 markers from Unigene (org.Hs.eg.db) to Annotation (rat2302.db) ... OK [261/868 (1:1)]
summary(mlx)
Types: 3 ['brain', 'liver', 'lung'] Mode: numeric Markers: 261 IDtype: .Affymetrix ['1369882_at', '1398649_at', ..., '1370458_at'] Values: [7.26871, 7.26871, ..., 5.00013] Source: rat2302.db Breakdown: brain liver lung 107 106 48
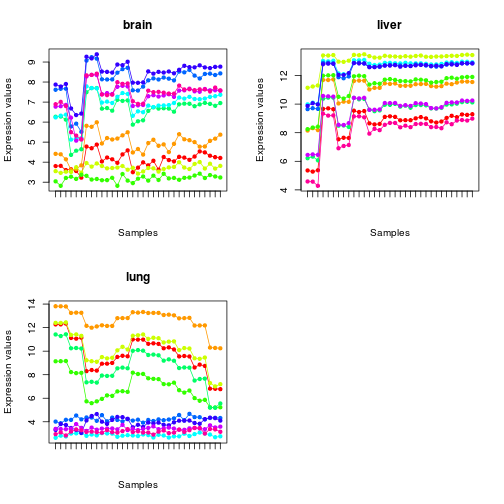
# QC on markers from their expression patterns in mixed samples
profplot(mlx[,1:10], mix)
Warning message: 'x' is NULL so the result will be NULL Warning message: 'x' is NULL so the result will be NULL Warning message: 'x' is NULL so the result will be NULL

# filter out poor markers using SCOREM (based on linear-scale expression)
mlsc <- extractMarkers(mlx, expb(mix, 2), method='SCOREM', alpha=10^-12)
summary(mlsc)
Types: 3 ['brain', 'liver', 'lung'] Mode: numeric Markers: 113 IDtype: .Affymetrix ['1373774_at', '1378796_at', ..., '1379653_a_at'] Values: [0.977665444448239, 0.974762280427837, ..., 0.951324094855668] Source: rat2302.db Breakdown: brain liver lung 17 81 15
# expresison patterns are more correlated
profplot(mlsc[,1:10], mix)
Warning message: 'x' is NULL so the result will be NULL Warning message: 'x' is NULL so the result will be NULL Warning message: 'x' is NULL so the result will be NULL

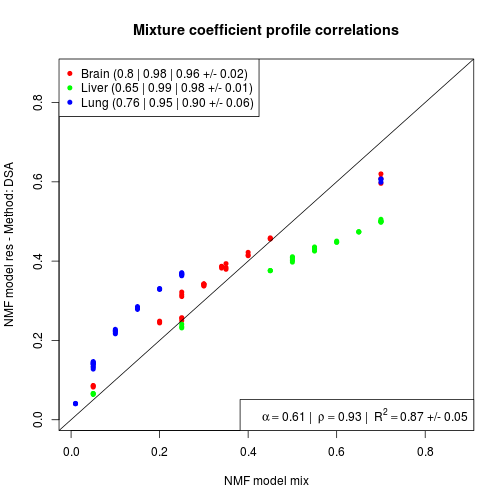
# apply DSA using all markers
res <- ged(mix[mlsc,], mlsc, 'DSA', verbose=TRUE)
Using ged algorithm: “DSA” Estimating basis and mixture coefficients matrices from marker features [DSA] Using 113/113 markers to estimate cell proportions: brain liver lung 17 81 15 Checking data scale ... NOTE [log] Converting data to linear scale ... OK [base: 2] Computing proportions using DSA method ... OK Estimating basis matrix from mixture coefficients [qprog] Not using any marker constraints Timing: user system elapsed 1.808 0.024 1.837 GED final wrap up ... OK
# plot against true proportions
profplot(mix, res)